

7. Economic appraisal frameworks
Making decisions between alternative investments, projects or policies that affect the provision of ecosystem services often involves weighing up and comparing multiple costs and benefits that are measured in different metrics and are incurred at different locations and points in time. For example, the establishment of a new marine protected area might involve costs in terms of the purchase of coastal land, compensation of local communities, and on-going maintenance and enforcement costs; and benefits in terms of biodiversity conservation, recreational use and enhanced fish stocks. These costs and benefits are likely to be measured in different units, be incurred at different locations by different groups of stakeholders, and have different time profiles. Organising, comparing and aggregating information on such a complexity of impacts; and subsequently choosing between alternative options with different impact profiles requires a structured approach. Economic methods for assessment, evaluation or appraisal of complex decision contexts provide systems for structuring the information and factors that are relevant to a decision.
There are a number of economic assessment methods available to help decision makers to structure the information and factors that are relevant to a decision and to select between alternative investments, projects or policies. The choice of which assessment method to use will largely be determined by the type of decision problem and the availability and nature of information related to each potential option. To understand the differences between economic assessment methods, we describe the procedural steps of each approach, which are often comparable yet differ in subtle ways.
•For decisions that involve selecting between options to achieve a single specific goal (e.g. meeting a specified ecological standard, achieving a targeted coverage of protected area) and where all costs can be expressed in monetary terms, the cost-effectiveness analysis (CEA) method can be used. This approach therefore does not involve any assessment of what the benefits are of meeting the objective but only compares alternative options in terms of their costs.
•When all the impacts of alternative options can be quantified in monetary terms, the most common economic assessment method is cost-benefit analysis (CBA). This assessment method involves summing up the value of the costs and benefits of each option and comparing options in terms of their net benefits (i.e. the extent to which benefits exceed costs).
•In the situation that the relevant criteria (costs and benefits) to the decision cannot be expressed in monetary values, but can only be expressed in other units or in qualitative terms (i.e. impacts can be ranked in order of importance), multi-criteria analysis (MCA) is a useful assessment method.
It should be noted that CEA, CBA and MCA are general economic assessment methods that can be applied to help select between alternative investments, projects and policies. In this toolkit the focus is on supporting decision-making regarding LME/MPA/ICM. Although the main steps in the assessment methods remain relevant, the nature of ecosystem-related decisions may require emphasis on specific types of input, particularly spatial analysis. The decision-making context regarding the management of ecosystem services is often one of spatial targeting or optimisation. Decisions are being made about where to invest in ecosystem restoration (e.g. CBD Aichi Target 11 that 10 per cent of coastal and marine areas are conserved through protected areas and other effective area-based conservation measures), or target financial incentives to change the behaviour of resource users. In such cases, the spatial correspondence of costs and benefits relevant to the decision is of crucial importance and mapping these inputs is a necessary step in the assessment process. The Marine Spatial Planning toolkit provides guidance on spatial assessment tools – see section 5.8.
7.1 Cost-Effectiveness Analysis (CEA)
Cost-effectiveness analysis (CEA) involves identifying the lowest cost option to achieve a given objective.4 CEA is an applicable assessment method for decisions that involve selecting between alternative measures or technologies to achieve a single specific goal (e.g. meeting a specified ecological standard, supplying a specified quantity of clean water, or sequestering a targeted quantity of carbon) and for which all costs can be measured in monetary terms.
The steps in conducting a CEA are take the following sequence, but there may be feedback loops between steps during the process.
•Step 1: Identify the environmental objective(s) involved (target situation).
•Step 2: Determine the extent to which the environmental objective(s) is (are) met.
•Step 3: Identify sources of pollution, pressures and impacts now and in the future over the appropriate time horizon and geographical scale (baseline situation).
•Step 4: Identify measures to bridge the gap between the reference (baseline) and target situation (environmental objective(s)).
•Step 5: Assess the effectiveness of these measures in reaching the environmental objective(s).
•Step 6: Assess the direct (and if relevant indirect) costs of these measures.
•Step 7: Rank measures in terms of increasing unit costs.
•Step 8: Determine the least cost way to reach the environmental objective(s) based on the ranking of measures .This approach therefore does not involve any assessment of the benefits of meeting the policy target but only compares alternative options in terms of their costs. As such, CEA is a relatively straightforward assessment method to apply and is relevant to decision contexts in which a specific policy target has been set. It does not, however, provide an indication of the magnitude of changes in societal welfare resulting from implementing policy options (i.e. whether society is better or worse off as a result of the decision).
In practice, this economic assessment method is not frequently used in the context of managing ecosystems due to the complex and multifunctional nature of ecosystem service provision. It is generally not the case that a single specific goal for ecosystem service provision can be set and it becomes necessary to consider the multiplicity and variability of benefits derived from alternative options.
7.2 Cost-Benefit Analysis (CBA)
Cost-benefit analysis (CBA) is the most commonly used economic assessment method for evaluating and comparing investments, projects and policies.
It is important to recognise the difference between a CBA that is carried out from the perspective of society as a whole and CBA that is conducted from the perspective of an individual, group, or firm. If applied from this latter perspective, CBA is generally used to determine the financial return of private investments. This private application is commonly known as a ‘financial CBA’. Alternatively, government departments apply CBA as the standard tool for evaluating investments, projects and policies from the perspective of society as a whole. This so-called ‘extended CBA’ is used as a method in which the societal costs and benefits of alternative options are expressed and compared in monetary terms. The extended CBA provides an indication of how much a prospective project or investment contributes to social welfare by calculating the extent to which the benefits of the project exceed the costs – essentially society’s ‘profit’ from a project. In this application, the CBA provides a framework into which monetised ecosystem service values can be integrated.
The main steps in performing a CBA are presented in Figure 11. These steps are described below:

Figure 11: Methodological steps in cost-benefit analysis (Brander and van Beukering, 2015)
The first step in a CBA is to identify the alternative options or alternatives to be considered. The options under consideration will generally be specific to the particular problem and context, but may include investments, projects, policies, development plans etc.
The impact assessment in a CBA starts with the identification of the complete set of negative impacts (costs) and positive impacts (benefits) related to the policy or intervention options under consideration. This includes costs and benefits accruing to all affected groups and individuals (not just those involved in the project development) and costs and benefits that are incurred in the future. It is important to describe the geographical and temporal boundaries of the analysis. This is especially crucial for ecosystem services impacts since effects emerging from ecosystem change often show major variations in time and space. The final step in the impact assessment phase is to quantify each cost and benefit in relevant physical units for each year in which it occurs. Estimating changes in ecosystem services requires specific expertise and models on ecological, hydrological and climatic processes.
To conduct a CBA, all of the quantified positive and negative effects need to be expressed in monetary units. In cases where costs and benefits are not directly observable in monetary terms in well-functioning markets (as is the case for many ecosystem services), estimates need to be generated using non-market valuation methods or value transfer (see Chapter 4).
The economic performance of each alternative option can be calculated in three different ways:
1The net present value (NPV) of each option is calculated by subtracting the present value costs from present value benefits. A positive NPV indicates that implementing a project will improve social welfare. The NPVs of alternative investments can be compared in order to identify the most beneficial project;
2The benefit cost ratio (BCR) is the ratio of discounted total benefits and costs, and shows the extent to which project benefits exceed costs. A BCR greater than 1 indicates that the benefits of a project exceed the costs;
3The internal rate of return (IRR) is the discount rate at which a project’s NPV becomes zero. If the IRR exceeds the discount rate used in the analysis, the project generates returns in excess of other investments in the economy, and can be considered worthwhile.
A final step in a CBA is to conduct sensitivity analysis to check the robustness of the conclusions to the assumptions made. Another element is to estimate whether or not the omission of certain costs and benefits that cannot be monetised affects the decision result.
An important drawback of CBA is the requirement that all costs and benefits need to be expressed in monetary terms. Although a range of economic valuation methods are available to estimate values for marketed and non-marketed ecosystem services, there are still considerable limitations to the accuracy of estimated value in some cases. Furthermore, the application of non-market valuation techniques can be expensive and time consuming. For these reasons it may not be possible to estimate monetary values for some costs and benefits and they cannot be entered into a CBA. In some cases, the omitted impacts can be significant and therefore alternative evaluation methods are needed.
Example Box 10: Cost-Benefit Analysis of expanding global marine protected areas
Currently, 3.4% of global marine area is designated as marine protected area (MPA), with 0.59% established as no-take MPAs. The location of existing MPAs is represented in Figure 1. The Convention on Biological Diversity (CBD) Aichi Target 11 and the Durban Action Plan call for an expansion of MPA coverage to 10% and 30% of global marine area respectively. To assess the economic rationale for MPA expansion, Brander et al. (2015) conduct a cost-benefit analysis to estimate the net benefits of expanding global marine protected areas (MPAs) to 10% and 30% coverage of total marine area. The study developed a set of six mapped scenarios for the global expansion of MPAs (see Figure 12). The scenarios vary along two dimensions: 1. The coverage of MPAs as a proportion of total marine area; 2. The characteristics of target locations for MPAs in terms of biodiversity and degree of human impact.
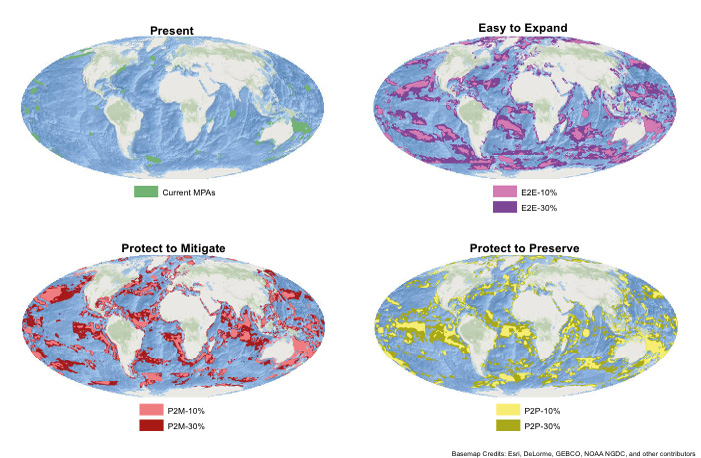
Figure 12. Current and future global distributions of marine protected areas
The methodological framework for the CBA incorporates spatially explicit estimations of bio-physical effects, benefits and costs and is represented by Figure 13.
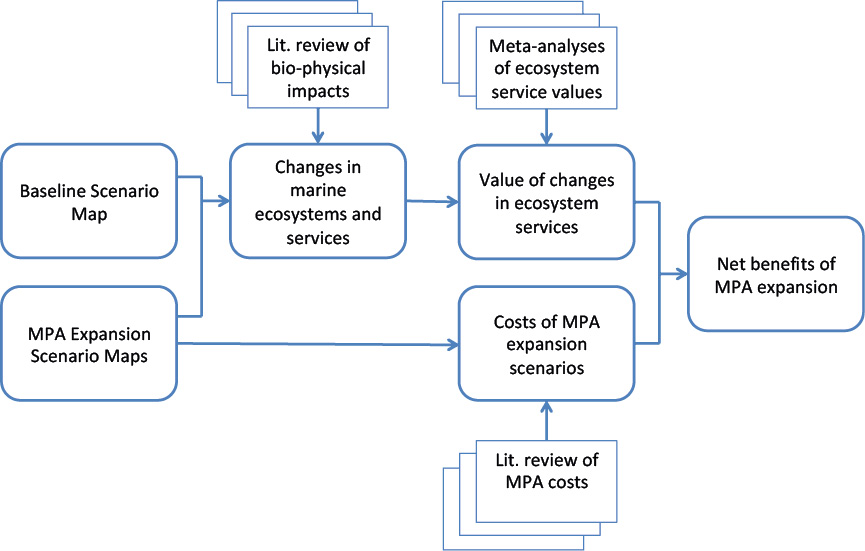
Figure 13: Methodological framework for cost-benefit analysis of expanding marine protected areas.
(Adapted from Figure 2, Balmford et al., 2011; and Figure 2, Hussain et al., 2011).
The results of the cost-benefit analysis show that all six scenarios for expanding MPAs to 10% and 30% coverage are economically advisable (see Figure 14). The ratios of benefits to costs are in the range 3.17 – 19.77. In the case of the scenario that achieves 10% coverage of total marine area and targets areas with high biodiversity and low human impact, each dollar invested yields a return of around 20 dollars in benefits.
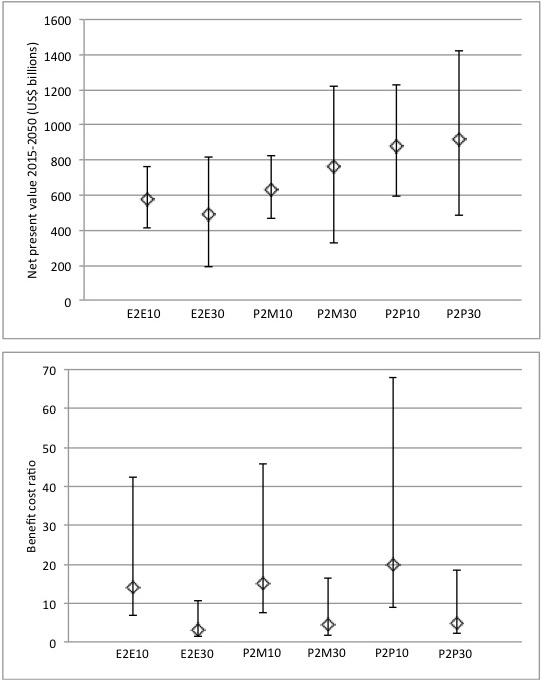
Figure 14. Net present values (US$; billions; 2013 price level; discount rate of 3%) and benefit cost ratios.
Error bars represent the combinations of high benefits-low costs (upper bound) and low benefits-high costs (lower bound) drawn from 95% prediction intervals for each cost and benefit.
7.3 Multi-Criteria Analysis (MCA)
Multi-criteria analysis (MCA) has become a well-established tool for decision-making that involves conflicting or multiple objectives. MCA can be used to establish preferences between alternative options by reference to a set of measurable criteria that the decision making body has defined. Unlike in a CBA, criteria do not need to be quantified in a common metric (i.e. money). Instead MCA provides a number of alternative ways of aggregating the data on individual criteria to provide indicators of the overall performance of options. This allows the inclusion in the analysis of effects that cannot be expressed in monetary terms. The basic idea behind MCA is to allow the integration of different objectives (or criteria) without assigning monetary values to all of them. In short, MCA provides a systematic method for comparing these criteria, some of which may be expressed in monetary terms and some of which are expressed in other units. The main steps in performing a MCA are presented in Figure 15.
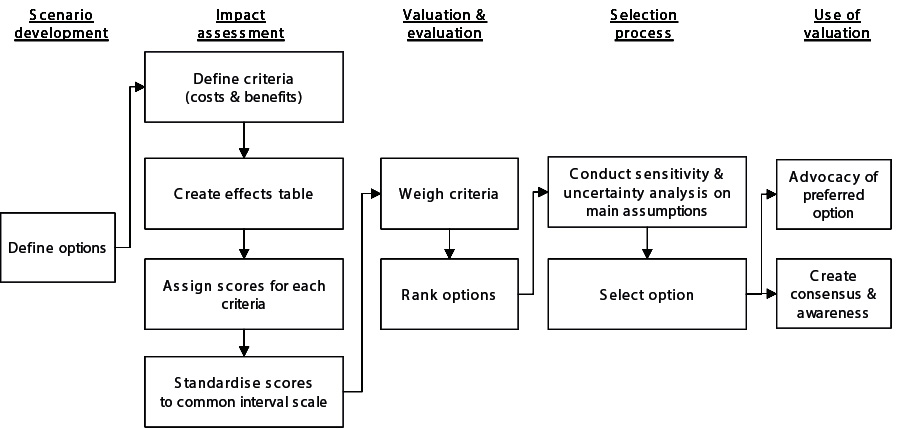
Figure 15: Methodological steps in multi-criteria analysis (Brander and van Beukering, 2015)
Impact assessment in a MCA involves identifying and defining all criteria that are relevant to the decision problem. These include all important categories of negative and positive effects resulting from the options under consideration. In a MCA it is possible to include criteria that are difficult to quantify and can perhaps only be assessed in qualitative terms such as political sensitivity, equity and irreversibility. The quantification of the different effects is summarised in an “effects table”, which is a matrix with the alternative options listed in the columns and the criteria listed in the rows. The effects table is completed by assigning scores to each criterion for each alternative. Information on the magnitude of each criterion can be expressed in monetary units, physical units, or simply on a qualitative scale. Data on impacts can be collected from surveys, existing data, experts, or stakeholders. In cases in which the spatial distribution of impacts is important to the decision, the data on impacts can be represented on maps. To enable the direct comparison of different criteria, standardisation of scores for each criterion to a common interval scale is conducted (usually to values between 0-100 or 0-1). There are several software packages available that can be used to help with the computations in MCA.5
MCA does not explicitly value the criteria in monetary terms but instead applies weighting of criteria to quantify the relative importance of each criterion in the decision process. Weights can be derived from existing information or from stakeholders by asking them to state their preferences for the various criteria. By combining the standardised scores and weights of the criteria, the alternative options can be ranked, usually through a weighted summation of criteria scores for each alternative. Similar to CBA, MCA applies sensitivity and uncertainty analysis to assess the robustness of the ranking result to changes in weights and scores. Finally, based on the ranking of options and the sensitivity of the results, a decision maker can select the most preferred option.
A key strength of MCA is that it is not necessary to quantify all impacts in monetary terms. This means that complex and time-consuming valuation studies of all environmental impacts can be avoided, and that qualitative criteria such as political sensitivity can be included in the decision framework. MCA can therefore provide a degree of structure, analysis, and openness to decision problems that lie beyond the practical reach of CBA.
MCA is, however, heavily reliant on the judgement of the analytical team for defining alternatives and criteria, estimating the relative importance of criteria and, to some extent, in calculating and inputting data into the effects table. The subjectivity that pervades these processes can be a matter of concern. The involvement of stakeholders in defining criteria and setting weights can also be time consuming process if conducted using surveys, interviews or deliberative methods. Another important limitation of MCA is that the results do not necessarily show whether alternative options produce welfare gains or losses. Unlike CBA, there is no decision rule (such as a positive NPV, a BCR greater than 1, or an IRR greater than the market interest rate) that indicates that benefits exceed costs. In MCA, as is also the case with CEA, the analysis can only produce a ranking of alternative options and does not indicate whether the options result in a welfare improvement. It is, however, often possible to include a business-as-usual alternative in the set of options, and this can be used as a reference point to indicate whether the other options are better or worse than undertaking no action.
Table 9: Summary of economic appraisal methods
|
Appraisal method |
Application |
Strengths |
Weaknesses |
|
Cost-Effectiveness Analysis (CEA) |
Used for identifying lowest cost policy options to achieve a given objective |
Does not require assessment of benefits and is analytically relatively straightforward |
Limited applicability to ecosystem services given complex and multi-functional nature of ES provision; and the absence of single quantified policy targets |
|
Cost-Benefit Analysis (CBA) |
Used to estimate the economic performance of investments and policies |
Provides a measure of how much an investment or policy contributes to societal wellbeing |
Requires that all costs and benefits are quantified in monetary terms; can result in omission of important effects |
|
Multi-Criteria Analysis (MCA) |
Used to rank alternative investments and policies |
Allows the inclusion of effects that cannot be expressed in monetary terms |
Heavily reliant on the subjective judgment of the analytical team |