
4. Valuation of ecosystem services
This chapter provides an overview of methods for estimating the value of ecosystem services in monetary units. A separate toolkit developed under GEF IW:LEARN Sub-Component 5.1 is dedicated specifically to methods for valuing ecosystem services in the LME/MPA/ICM context.
The application of economic valuation methods generally involves a high degree of stakeholder engagement, from key informant interviews for identifying important ecosystem services to in-depth surveys of beneficiaries.
The Stakeholder Engagement toolkit, Section 4, provides an overview of stakeholder engagement processes and tools.
Information on the economic value of ecosystem services can be useful for a number of different policy and decision making contexts including: advocacy and public awareness raising; appraisal of projects, investments and policies; impact assessment; sustainable financing; and setting compensation for environmental damage.
In the LME context, information on the economic value of ecosystem services derived from a LME and how these values might change in the future can be useful input in the Transboundary Diagnostic Analysis (TDA). The GEF LME:LEARN Project Cycle toolkit Section 3 and Strategic Approach toolkit Section 3 provide detail on the TDA process.
Example Box 5: The total economic value of Bonaire Marine Park
Bonaire is an island in the Caribbean located north west of Venezuela and is formally a special municipality of the Netherlands. Bonaire spreads across 288 km2 and is famous for its coral reefs. The entire coastline of Bonaire is protected, with the status of Marine Park established in 1979. The value of Bonaire’s ecosystems to tourism has been assessed to be much higher than in other comparable sites. Bonaire is very popular among the diving community and is consistently ranked in the Top 3 of the Scuba Diving Magazine. As a result, the economy of Bonaire relies greatly on dive tourism.
Another distinctive feature of the Bonaire Marine Park is the high non-use value of the marine ecosystem. An extensive survey among citizens of the Dutch mainland revealed a high appreciation of Bonaire’s ecosystems, even if these people have no intention of visiting the island. The average annual amount that residents of the Netherlands are willing to pay for nature protection in the Caribbean Netherlands is estimated at around USD 7 per household, which aggregates to a total of USD 60 million. As shown in Figure 8, this constitutes the largest component of the Total Economic Value of Bonaire’s ecosystems.
This evidence of the willingness to pay of Dutch mainland citizens for nature conservation in the Caribbean Netherlands built an argument for securing a €7.5 million investment for nature conservation on the three Dutch islands by the Ministry of Economic Affairs. Also WWF Netherlands used the study results to allocate a budget for conservation efforts in the Caribbean Netherlands.
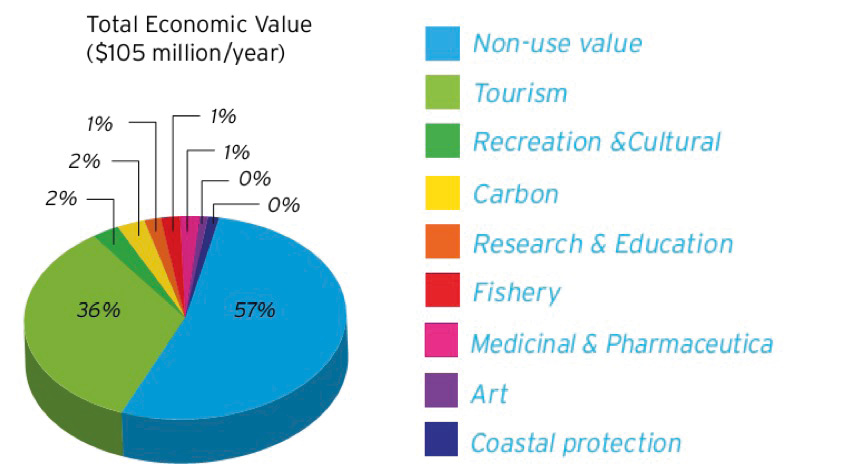
Figure 8: The contribution of non-use values to the Total Economic Value of the ecosystems of Bonaire
4.2 Valuation methods and when to use them
A variety of methods have been developed for estimating the economic value of ecosystem services that are designed to span the range of valuation challenges raised by the application of economic analyses to the complexity of the natural environment. Figure 9 provides a representation of the available economic methods for valuing ecosystem services. We separately introduce methods that produce new or original information generally using primary data (primary valuation methods) and those that use existing information in new policy contexts (value transfer methods).
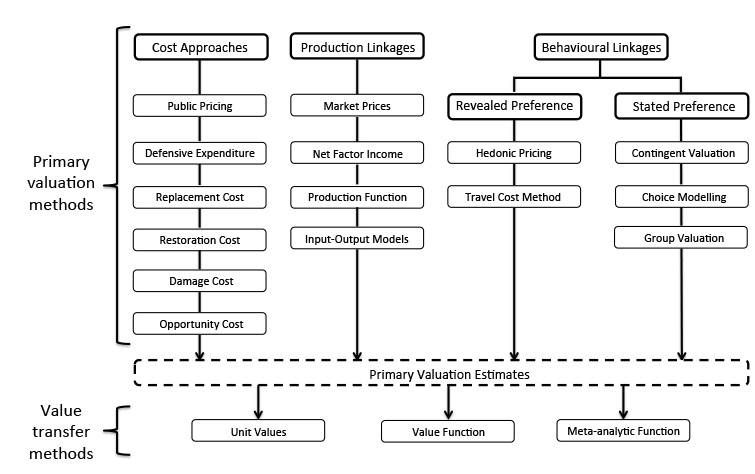
Figure 9: Overview of primary valuation and value transfer methods
Primary valuation methods
Table 6 provides an overview of primary valuation methods, typical applications, limitations and indicates which primary valuation methods can be used to value which ecosystem service. An important distinction to be aware of between primary valuation methods is the difference between revealed preference methods (those that observe actual behaviour of the use of ecosystem services to elicit values) and stated preference methods (those that use public surveys to ask beneficiaries to state their preferences for, generally hypothetical, changes in the provision of ecosystem services). Revealed preference methods may be favoured since they reflect actual behaviour but are limited in their applicability to some ecosystem services. Stated preference methods on the other hand rely on responses recorded in surveys or experiments but are more flexible in their application.
It should be noted that different valuation methods produce different measures of economic value that are not equivalent and cannot necessarily be directly compared. The valuation method, and the measure of economic value that it estimates, will have a substantial bearing on the magnitude of the value estimated. It is therefore important to understand what each measure is and to select a measure that is relevant to the case in hand. There are numerous existing publications that provide guidance on the use of primary valuation methods. A selection of these are listed in Section 4.5.
Table 6: Primary valuation methods, applicability to ecosystem services, examples and limitations (adapted from Table A2, Brander 2013)
|
Valuation method |
Approach |
Application to ecosystem services |
Example ecosystem service |
Limitations |
|
Market prices |
Prices for ES that are directly observed in markets |
ES that are traded directly in markets |
Timber and fuel wood from forests; clean water from wetlands |
Market prices can be distorted e.g. by subsidies. Most ES are not traded in markets |
|
Public pricing |
Public expenditure or monetary incentives (taxes/subsidies) for ES as an indicator of value |
ES for which there are public expenditures |
Watershed protection to provide drinking water; Purchase of land for protected area |
No direct link to preferences of beneficiaries |
|
Defensive expenditure |
Expenditure on protection of ES |
ES for which there is public or private expenditure for its protection |
Recreation and aesthetic values from protected areas |
Only applicable where direct expenditures are made for environmental protection related to provision on an ES. Provides lower bound estimate of ES benefit |
|
Replacement cost |
Estimate the cost of replacing an ES with a man-made service |
ES that have man-made equivalents |
Coastal protection by dunes (replaced my seawalls); water storage and filtration by wetlands (replaced by reservation and filtration plant) |
No direct relation to ES benefits. Over-estimates value if society is not prepared to pay for man-made replacement. Under-estimates value if man-made replacement does not provide all of the benefits of the original ecosystem |
|
Restoration cost |
Estimate cost of restoring degraded ecosystems to ensure provision of ES |
Any ES that can be provided by restored ecosystems |
Coastal protection by dunes; water storage and filtration by wetlands |
No direct relation to ES benefits. Over-estimates value if society is not prepared to pay for restoration. Under-estimates value if restoration does not provide all of the benefits of the original ecosystem. |
|
Damage cost avoided |
Estimate damage avoided due to ecosystem service |
Ecosystems that provide storm, flood or landslide protection to houses or other assets |
Coastal protection by dunes; river flow control by wetlands; landslide protection by forests |
Difficult to quantify changes in risk of damage to changes in ecosystem quality |
|
Social cost of carbon |
The monetary value of damages caused by emitting one tonne of CO2 in a given year. The social cost of carbon (SCC) therefore also represents the value of damages avoided for a one tonne reduction in emissions |
Carbon storage and sequestration |
Carbon sequestered and stored by protected or restored forests |
SCC is a specific application of the “damage cost avoided” method. SCC is characterised by high modeling uncertainties and partial coverage of climate change impacts |
|
Opportunity cost |
The next highest valued use of the resources used to produce an ecosystem service |
All ecosystem services |
The opportunity cost of ecosystem services from a natural ecosystem might be the value of agricultural output if the land is converted to agricultural instead of conserved in a natural state |
Measures the cost of providing ecosystem services instead of the benefit |
|
Net factor income (residual value) |
Revenue from sales of ecosystem-related good minus cost of other inputs |
Ecosystems that provide an input in the production of a marketed good |
Filtration of water by wetlands; commercial fisheries supported by coastal wetlands |
Tendency to over-estimate values since all normal profit is attributed to the ES |
|
Production function |
Statistical estimation of production function for a marketed good including an ES input |
Ecosystems that provide an input in the production of a marketed good |
Soil quality or water quality as an input to agricultural production |
Technically difficult. High data requirements |
|
Input-Output Models |
Quantifies the interdependencies between economic sectors in order to measure the impacts of changes in one sector to other sectors in the economy. Ecosystems can be incorporated as distinct sectors |
Ecosystem services with direct and indirect use values, particularly inputs into production |
Ecosystem inputs into agriculture; or into the tourism sector |
Requires substantial data on ecosystem-economy linkages to parameterise connections between sectors |
|
Hedonic pricing |
Estimate influence of environmental characteristics on price of marketed goods |
Environmental characteristics that vary across goods (usually houses) |
Urban green open space; air quality moderated by ecosystems |
Technically difficult. High data requirements. Limited to ES that are spatially related to property locations |
|
Travel cost |
Estimate demand for ecosystem recreation sites using data on travel costs and visit rates |
Recreational use of ecosystems |
Recreational use of national parks |
Technically difficult. High data requirements. Limited to valuation of recreation. Complicated for trips with multiple purposes or to multiple sites |
|
Contingent valuation |
Ask people to state their willingness to pay for an ES through surveys |
All ecosystem services |
Biodiversity; recreation; landscape aesthetics; flood risk attenuation |
Expensive and technically difficult to implement. Risk of biases in design and analysis |
|
Choice modelling (choice experiment) |
Ask people to make trade-offs between ES and other goods to elicit willingness to pay |
All ecosystem services |
Biodiversity; recreation; landscape aesthetics; flood risk attenuation |
Expensive and technically difficult to implement. Risk of biases in design and analysis |
|
Group / participatory valuation |
Ask groups of stakeholders to state their willingness to pay for an ES through group discussion |
All ecosystem services |
Biodiversity; recreation; landscape aesthetics; flood risk attenuation |
Risk of biases due to group dynamics |
Value transfer methods
Decision-making often requires information quickly and at low cost. New ‘primary’ valuation research, however, is generally time consuming and expensive. For this reason there is interest in using information from existing primary valuation studies to inform decisions regarding impacts on ecosystems that are of current interest. This transfer of value information from one context to another is called value transfer.
Value transfer is the use of research results from existing primary studies at one or more sites or policy contexts (“study sites”) to predict welfare estimates or related information for other sites or policy contexts (“policy sites”). Value transfer is also known as benefit transfer but since the values that are transferred may be costs as well as benefits, the term value transfer is more generally applicable.
In addition to the need for expeditious and inexpensive information, there is often a need for information on the value of ecosystem services at a different geographic scale from that at which primary valuation studies have been conducted. So even in cases where some primary valuation research is available for the ecosystem of interest, it is often necessary to extrapolate or scale-up this information to a larger area or to multiple ecosystems in the region or country. Primary valuation studies tend to be conducted for specific ecosystems at a local scale whereas the information required for decision-making, and indeed for LMEs, is often needed at a regional or multi-national scale. Value transfer therefore provides a means to obtain information for the scale that is required.
The number of primary studies on the value of ecosystem services is substantial and growing rapidly. This means that there is a growing body of evidence to draw on for the purposes of transferring values to inform decision-making. With an expanding information base, the potential for using value transfer is improved.
Value transfer can potentially be used to estimate values for any ecosystem service, provided that there are primary valuations of that ecosystem service from which to transfer values. Value transfer methods have been employed widely in national and global ecosystem assessments, value mapping applications and policy appraisals. The use of value transfer is widespread but requires careful application. The alternative methods of conducting value transfer are described here:
1Unit value transfer uses values for ecosystem services at a study site, expressed as a value per unit (usually per unit of area or per beneficiary), combined with information on the quantity of units at the policy site to estimate policy site values. Unit values from the study site are multiplied by the number of units at the policy site. Unit values can be adjusted to reflect differences between the study and policy sites (e.g. income and price levels).
2Value function transfer uses a value function estimated for an individual study site in conjunction with information on parameter values for the policy site to calculate the value of an ecosystem service at the policy site. A value function is an equation that relates the value of an ecosystem service to the characteristics of the ecosystem and the beneficiaries of the ecosystem service. Value functions can be estimated from a number of primary valuation methods including hedonic pricing, travel cost, production function, contingent valuation and choice experiments.
3Meta-analytic function transfer uses a value function estimated from the results of multiple primary studies representing multiple study sites in conjunction with information on parameter values for the policy site to calculate the value of an ecosystem service at the policy site. A value function is an equation that relates the value of an ecosystem service to the characteristics of the ecosystem and the beneficiaries of the ecosystem service. Since the value function is estimated from the results of multiple studies, it is able to represent and control for greater variation in the characteristics of ecosystems, beneficiaries and other contextual characteristics. This feature of meta-analytic function transfer provides a means to account for simultaneous changes in the stock of ecosystems when estimating economic values for ecosystem services (i.e. the “scaling up problem”). By including an explanatory variable in the data describing each “study site” that measures the scarcity of other ecosystems, in the vicinity of the “study site”, it is possible to estimate a quantified relationship between scarcity and ecosystem service value. This parameter can then be used to account for changes in ecosystem scarcity when conducting value transfers at large geographic scales.
These three principal methods for transferring ecosystem service values are summarised in Table 7 together with their respective strengths and weaknesses. The choice of which value transfer method to use to provide information for a specific policy context is largely dependent on the availability of primary valuation estimates and the degree of similarity between the study and policy sites. In cases where value information is available for a highly similar study site, unit value transfer may provide the most straightforward and reliable means of conducting value transfer. On the other hand, when study sites and policy sites are different, value function or meta-analytic function transfer offers a means to systematically adjust transferred values to reflect those differences. Similarly, in the case that value information is required for multiple different policy sites, value function or meta-analytic function transfer may be a more accurate and practical means for transferring values. Using meta-analytic functions that include a parameter for ecosystem scarcity provides a means to account for simultaneous changes in the stock of ecosystem on the value of all ecosystem services (i.e. more accurately “scale-up” ecosystem service values).
Table 7: Value transfer methods, strengths, weaknesses and tier (adapted from Brander 2013)
|
Approach |
Strengths |
Weaknesses |
|
|
Unit value transfer |
Select appropriate values from existing primary valuation studies for similar ecosystems and socio-economic contexts. Adjust unit values to reflect differences between study and policy sites (usually for income and price levels) |
Simple |
Unlikely to be able to account for all factors that determine differences in values between study and policy sites. Value information for highly similar sites is rarely available |
|
Value function transfer |
Use a value function derived from a primary valuation study to estimate ES values at policy site(s) |
Allows differences between study and policy sites to be controlled for (e.g. differences in population characteristics) |
Requires detailed information on the characteristics of policy site(s) |
|
Meta-analytic function transfer |
Use a value function estimated from the results of multiple primary studies to estimate ES values at policy site(s) |
Allows differences between study and policy sites to be controlled for (e.g. differences in population characteristics, area of ecosystem, abundance of substitutes etc.). Practical for consistently valuing large numbers of policy sites. |
Requires detailed information on the characteristics of policy site(s). Analytically complex |
4.3 Distributional considerations
Distribution of impacts across stakeholders
The distribution of costs and benefits across different groups in society is usually an important criterion in public decision-making and needs to be addressed as part of the assessment process. The allocation of the benefits and costs among different groups within society may well determine the political acceptability of alternative options.
The uneven distribution of costs and benefits has both practical and ethical consequences. In practical terms, it is important to assess the burden of costs and benefits received by local stakeholders, as they often have a strong influence on how successful project implementation will be. It is often the case with the establishment of protected areas that attempting to exclude local stakeholders from accessing an environmental resource will not be successful without sharing the benefits of conservation with them. Understanding who gains and who loses from each policy option can provide important insights into the incentives that different groups have to support or oppose each project. This approach can thus provide useful information in the design of appropriate responses and increase success in implementing projects/plans.
In terms of ethical considerations, the analysis of the distribution of costs and benefits is important to ensure that conservation interventions do not harm vulnerable groups within society. Identifying and estimating the distribution of costs and benefits across different groups is the first step in designing measures to avoid disproportionate or undesirable allocation of impacts, compensation mechanisms, or payment schemes between gainers and losers. A general approach to identifying which groups will be affected by alternative options is through stakeholder analysis. One way of displaying the distributional effects of alternative options is to construct a distributional matrix, which displays the costs and benefits of a policy option, and shows how they are distributed among different socio-economic groups.
Information on the distribution of the impacts of alternative options may be included directly in a MCA as an additional criterion in the analysis, which then contributes to the overall weighted standardised score of each option. It is technically more challenging to include distributional considerations directly in a CBA. Generally, the distributional consequences of alternative options can be provided alongside the outputs of the analysis as additional information for decision-makers to consider.
Spatially distributed impacts
As noted earlier, the decision-making context regarding the management of ecosystem services is often one of spatial targeting. Decisions are being made about where to invest in ecosystem restoration, establish of protected areas, or target financial incentives to change the behaviour of land users. In this case, the spatial correspondence of costs and benefits relevant to the decision is of crucial importance and mapping these inputs is necessary.
The spatial distribution of impacts from alternative policy options may also be of interest to decision makers, particularly where different user groups are located in different areas. The analysis of the spatial distribution of impacts may be seen as an extension of the distributional analysis described in the previous section and may be a useful approach to identifying different societal groups that are impacted by a project. For example, projects that address water management at a river basin level are likely to affect upstream and downstream stakeholders differently – and this should be identified through spatial analysis. Alternative policy options will generally result, not only in different aggregate costs and benefits, but also in the spatial distribution of impacts. If these differences in spatial distribution are considered of importance, they also need to be represented to decision makers.
Temporally distributed impacts
Most policy options will result in impacts not only in the year in which they are implemented but also over a number of years into the future. Both the costs and benefits of a project will therefore have a temporal distribution. It is often the case that projects involve initial investment costs followed by a stream of benefits received over several years in the future. It is important to account for this distribution of costs and benefits over time because people tend to value a benefit or cost in the future less than a benefit or cost now. The practice of accounting for this time preference is called discounting and involves putting a higher weight on current values.
There are two motivations for this higher weighting of current values. The first is that people are impatient and simply prefer to have things now rather than wait to have them in the future. The second reason is that, since capital is productive, a Euro’s worth of resources now will generate more than a Euro’s worth of goods and services in the future. Therefore, an entrepreneur is willing-to-pay more than one Euro in the future to acquire one Euro’s worth of these resources now. In most cases, the discount rate is therefore based on the opportunity cost of capital – the prevailing rate of return on investments elsewhere in the economy, i.e. the interest rate.
The usual way to deal with temporally distributed values is to apply a discount rate to future values so that they can be compared as “present values”. Suppose an annual value of an ecosystem service X $ will occur over a period of T years, and a discount rate of r per cent is applied, then the present value of the ecosystem service is:
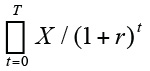
The present value of the value X in any given year with t>0, X/(1+r)t, is smaller than the value X in year t=0. From the equation it can be seen that the higher the discount rate r and the higher the number of years (t), the lower the discounted value of future benefits in any given year.
The choice of the appropriate discount rate remains a contentious issue because it often has a significant impact on the outcome of the analysis (Pearce. 2003, Kahn and Greene 2013) Various respected organisations provide advice on the discount rate to be used. For example, the UK Treasury guidelines recommend a discount rate of 6% for public sector projects while for most environmental and social impact studies 3.5% is recommended.
US Environmental Protection Agency (EPA) website
There is evidence to suggest that people discount the future differently for different goods. If people have lower rates of time preference for environmental goods than for money, a lower discount rate than the interest rate should be used. It is also possible that rates of time preference diminish over time, i.e. that the discount rate declines for impacts in the far future. The choice of discount rate can have a large impact on the findings of an evaluation or valuation study, and should, therefore, be varied in a sensitivity analysis to check how it influences the results.
4.4 Assessing and communicating uncertainty
The magnitude of uncertainty regarding estimated values needs to be quantified and communicated in order to provide an understanding of the robustness of the value information provided. Decision makers can then assess whether the information is sufficiently precise to be considered in making the decision. A balance has to be struck between presenting too little information on the level of uncertainty (e.g. giving the impression of high certainty for a central estimate) and too much information that cannot be taken in (e.g. a table of results for an extensive sensitivity analysis).
Alternative ways to quantify and communicate uncertainties in value transfer include:
1Ranges of values. In cases where multiple primary value estimates are available for the ecosystem service under consideration, the range of values can be presented to give an impression of the variability of unit value estimates.
2Distribution of values. In order to give a more complete picture of the distribution of value estimates, information on the average, median and standard error of the average value can be presented (in addition to information on the range of values). Minimum and maximum values may be ‘outliers’ and not necessarily representative of the likely values of the ecosystem service.
3Confidence intervals. A confidence interval is an estimated range of values which is likely to include the actual value. The estimated range is calculated from the set of sample data on the ecosystem service value under consideration. Confidence intervals are usually expressed as a range of values within which the actual value lies with a given confidence level or probability.
4Sensitivity analysis. A sensitivity analysis can be used to show how estimated ecosystem service values change as value function parameters, data inputs and assumptions change. A sensitivity analysis involves systematically varying (within plausible ranges) the uncertain inputs to a model to assess how sensitive the results are to those changes. Joint sensitivity analysis (varying more than one parameter at a time) is sometimes also useful if possible changes in parameters are not independent of each other. In this case, scenarios can be developed that describe how multiple parameters might change in combination.
5Transfer errors. The percentage difference between the actual value and the transferred value is called the ‘transfer error’. The formula for calculating transfer error is:
Transfer error = (predicted value - observed value) / observed value
For example, a transfer error of 50% means that the predicted value is 50% higher or lower than the observed value at the policy site). Assessments of transfer errors show the difference between the transferred value and the actual value of the ecosystem service. Since in most cases the actual value is unknown, it is generally not possible to compute transfer errors (indeed if we knew the actual value we wouldn’t need to use value transfer). Nevertheless, studies that do examine transfer errors (i.e. compare primary and transferred values) provide an indication of how accurate value transfer is in general.
It is evident that in almost all cases the value of ecosystem services will not be estimated with complete certainty. The question, therefore, becomes how much uncertainty is too much? Assessments of the ‘size’ of uncertainty are important but require careful interpretation and are not comparable across contexts. Arguably, the simplest and most general answer to this question is that the degree of uncertainty becomes unacceptable when a valuation estimate no longer provides information that enables better decisions to be made. For example, if the level of uncertainty is such that the analyst or decision maker can still tell whether, say, benefits (with uncertainty) are still clearly larger or smaller than costs, then that information helps the decision and the level of uncertainty is acceptable.
Different decision making contexts may require different levels of certainty regarding the information that they use. For example, the use of value information for raising general awareness of the importance of ecosystem services arguably does not need to be as accurate as valuation information used in litigation for compensation of damages to ecosystems. A general ordering of decision contexts with respect to their required level of accuracy for value information is represented in Figure 10.
The uncertainty of value transfers and the accuracy requirement of each decision making context should be assessed to determine whether value transfer can provide sufficiently accurate information. In the case that value transfer is judged to be insufficiently accurate, it is advisable to conduct primary valuations of ecosystem services, if resources (data, time, expertise, knowledge) are available.
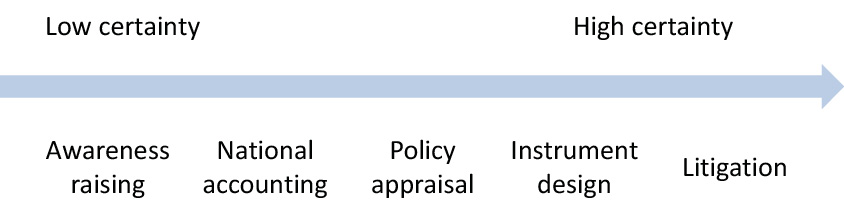
Figure 10. Value certainty requirements for different applications of value information (adapted from Eftec, 2009)
►JWRI guidance toolkit on coastal capital
►VALUES Methods for integrating ecosystem services into policy, planning, and practice
►UNEP guidance toolkit on value transfer
►Ecosystem Services Valuation Database (ESVD)
►The Economics of Ecosystems and Biodiversity (TEEB)
►Guidance Manual on Valuation and Accounting of Ecosystem Services for Small Island Developing States
►NEP Guidance toolkit for the valuation of regulating services
►Economic Valuation of Environmental and Resource Costs and Benefits in the Water Framework Directive: Technical Guidelines for Practitioners.
►Guidance for policy and decision makers on using an ecosystems approach and valuing ecosystem services.
►An introductory guide to valuing ecosystem services
►The Measurement of Environmental and Resource Values.
►Handbook on Biodiversity Valuation.
►Economic Valuation with Stated Preference Techniques Summary Guide
►An instrument for assessing the quality of environmental valuation studies.